
Researchers on the cutting edge of geochemistry are tracing Earth’s history through the clues recorded in tiny mineral crystals. Often, they must work with the microscopic (or nanoscopic) features in rare, hard-won specimens to pull apart the complete history of the mineral’s formation. Even in large pieces of rock, microscopic variability may be distributed throughout in patterns that contain valuable information. Researchers using microanalysis have read the information stored in layers of a single zircon crystal, the cements in a sandstone, tiny shells of sea creatures like ammonite hatchlings, and minerals in a meteorite.
A variety of imaging and chemical analysis techniques produce maps illustrating how chemical elements and crystal growth features are distributed across a specimen. Currently, these data are shared through static figures or images contained in a data repository, but this setup does not facilitate deeper inquiry and full use of spatial relationships. What if widely used geographic information system (GIS) software, which typically deals with data on the scale of many square kilometers, could be applied to data on a microscopic scale?
Here we showcase use of the free and open source software QGIS to integrate in situ chemical data with images to enrich interpretation.
Integrating the InformationMinimally destructive geochemical analysis at the nanometer to micrometer scale can peel apart the events that took place over the formation of a mineral crystal and still preserve the crystal for future analyses.Minimally destructive geochemical analysis at the nanometer to micrometer scale can peel apart the events that took place over the formation of a mineral crystal and still preserve the crystal for future analyses. This analysis is especially important for deciphering the geological history of a specimen that is small, rare, or zoned, like a 4.4-billion-year-old zircon.
No one analytical technique, however, can provide all necessary information for many questions, and the range of instrument manufacturers and data types involved makes integrating data from various instruments difficult.
To understand, for instance, how cementation in a sandstone evolved or the chemical evolution of a magma, images from light microscopes or scanning electron microscopes (SEM) are used to examine petrographic relationships, and then electron probe microanalysis (EPMA) provides point analyses of elemental composition (Figure 1).
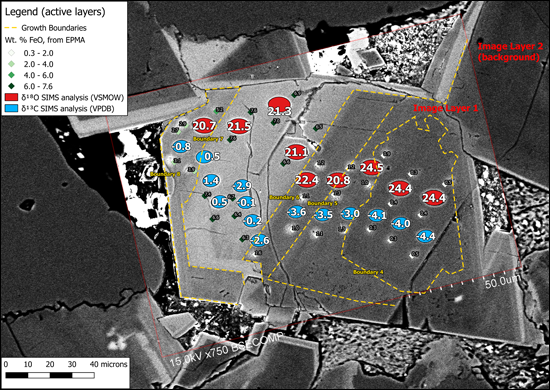 Fig. 1. To create this map of a zoned dolomite-ankerite grain from a polished rock surface, we used QGIS software to composite several SEM-backscattered electron image layers. We overlaid these with two SIMS transects and an EPMA data set. We added the final polygon layer (yellow dotted lines) to draw visual attention to different growth domains within the crystal. Data are from Denny et al. [2017]. Credit: A. C. DennyIn situ microanalytical techniques have become faster and more precise, and they are now routinely used in the geosciences [Valley and Kita, 2009; Sylvester and Jackson, 2016]. Microanalytical instruments like secondary ion mass spectrometers (SIMS), electron probe microanalyzers, and laser ablation–inductively coupled plasma–mass spectrometers produce large data sets from individual thin sections or chips (Figure 1). Other techniques like optical light microscopy, SEM, X-ray mapping, and nano-SIMS produce suites of images.
For years, scientists have managed field-scale data that span scales of meters to kilometers, incorporating images and point information using GIS software. However, in situ microanalytical data, like SEM images and SIMS or EPMA point analysis, also fundamentally contain spatial information that can be combined using GIS.
On a field scale, data in a map may have vector components (e.g., points, lines, or polygons) or raster components (e.g., images or similar pixel-based scans). In the case of microanalytical data, SIMS or EPMA data can be treated as vectors, and SEM scans or other images can be treated as rasters. Spatially overlapping sampling images and point analyses allow relation of these data sets to each other for visualization and further exploration.
Adapting an Open Source ToolQGIS is a free, open source, user-friendly, cross-platform (Mac, Windows, Linux, Unix, and Android) software package for collecting and processing macroscopic geographic data. Under the banner of the Open Source Geospatial Foundation, a community of volunteers maintains and develops the software with financial support from corporate and nonprofit sponsors.
We have compiled in situ microanalytical data from multiple instruments to create integrated maps of individual samples.Although QGIS was not originally designed for microanalytical techniques, we have compiled in situ microanalytical data from multiple instruments to create integrated maps of individual samples.
QGIS has many advantages, making it a good candidate for adoption by the wider microanalytical community for data visualization and management. First, the open-source nature removes the cost barrier to adopting the platform. Second, the software is supported by a growing international community of users and developers. Finally, custom plug-ins can be written in the Python, C++, and R computer languages, and these can provide ways of refining data input for different instruments. Plug-ins written in Python can be tailored to specific structured instrumental outputs to speed data compilation.
Map generation in QGIS for microanalytical data sets is straightforward (Figure 2). A tutorial structured to teach refined use of QGIS is available at the WiscSIMS Micro-QGIS website.
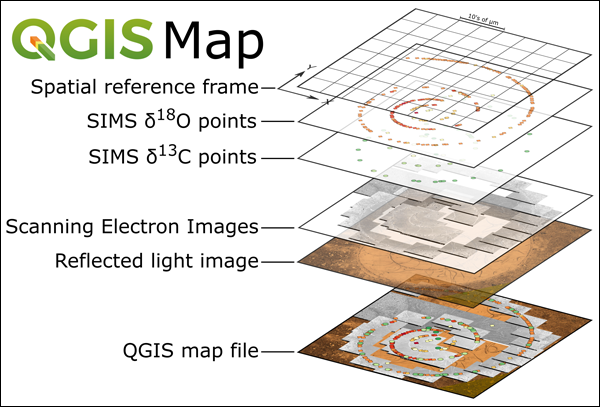 Fig. 2. This workflow for data import into QGIS relies on x–y coordinates from one instrument to calibrate the map units. In our examples, we use SIMS files from a CAMECA IMS 1280 instrument for calibration, and the units are micrometers. We also use our SEM Image Placer plug-in to position tens of SEM images simultaneously. Results of this data integration are shown in Figure 3. Data are from Linzmeier et al. [2018]. Credit: B. J. Linzmeier and A. C. Denny Creating Plug-ins
QGIS plug-ins can be created to solve specific problems relevant to a lab, analytical technique, or scientific question. We have used a plug-in called Plugin Builder to create several tools specific to the WiscSIMS laboratory at the University of Wisconsin–Madison. This platform provides a basic framework and files for building your own plug-in to interface with QGIS.
We have developed a plug-in that places images using the x–y coordinates of a microscope stage to align SEM images with data maps from other instruments. The software parses a text file made by our SEM (Hitachi S3400-N) that contains image dimension, stage coordinates, and pixel size and loads the associated images into a QGIS map. We are distributing our SEM Image Placer plug-in on GitHub, so anyone can download, fork, modify, and make a pull request for the development under the GNU General Public License to extend this functionality to other types of SEMs and other microscopes with stage coordinates.
Integrating and Archiving a Diversity of DataUsing free, open source QGIS software for the integration of in situ microanalytical data sets improves our ability to integrate data from multiple instruments. It also decreases the time spent annotating and reformatting supplemental data sets for publication (Figures 1 and 3).
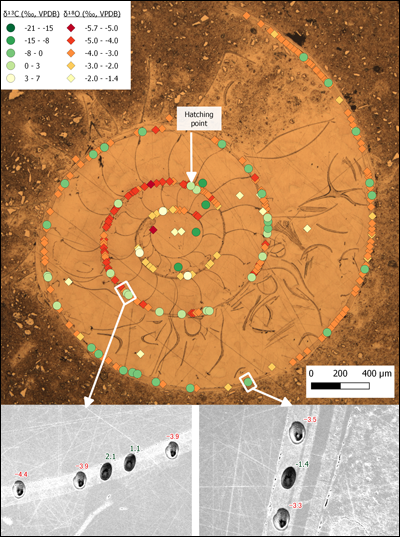 Fig. 3. This map for AMNH 75647, currently the most analyzed ammonite (extinct marine mollusk) in the world, was completely generated in the QGIS composer. After compiling the data, a user with intermediate-level skills could use this composer to create an initial figure in less than 20 minutes. The project file that was used to create this map integrates all the analytical data performed on this small SIMS mount. Data are from Linzmeier et al. [2018].Data collected from multiple instruments can be compiled quickly using built-in tools and custom-designed components. Adapting GIS software to the microscale also enables us to perform more complex spatial analysis. Most important, these compiled microspatial data can be shared between collaborators and used to explore patterns that may not be obvious from static displays of images and data points.
Our compilations use standard, widely used file formats, so they have the potential to interface easily with database infrastructure for archiving and depositing data collected with public funding [Chan et al., 2016]. This potential will ensure that extensive, expensive, and cutting-edge in situ geochemical data sets are easily shared and integrated into existing databases like Macrostrat using widely available formats and software.
AcknowledgmentsWe thank John Czaplewski, Shanan Peters, Ian Orland, and others for discussion and troubleshooting the QGIS workflow. The WiscSIMS laboratory is partially supported by the National Science Foundation (EAR03-19230, EAR13-55590) and the University of Wisconsin–Madison.
The post Making Maps on a Micrometer Scale appeared first on Eos.
from Eos https://eos.org/project-updates/making-maps-on-a-micrometer-scale?utm_source=rss&utm_medium=rss&utm_content=making-maps-on-a-micrometer-scale
via IFTTT
