
In the early morning hours of 28 January 2014, satellite data showed snow accumulating in the clouds over Birmingham, Ala., but weather forecasters predicted only a “light dusting” of snow for the day ahead. Over the course of the next several hours, the snow began to fall—and kept on falling. Although the area got only a couple of inches of snow, it was enough to bring this southern city to a standstill. Commuters abandoned their cars on the freeways and spent the night in office buildings and shopping centers. Children slept in classrooms and day care centers because their parents could not come to bring them home.
Rainfall rates derived from satellite data have a long legacy in operational weather forecasting because their information complements ground observations such as weather radar and rain gauges. Satellite precipitation estimates also fill in voids where ground measurements are lacking, for example, in mountainous regions. Until recently, however, satellite-derived snowfall rates have been difficult to achieve because of the challenges in detecting and quantifying them from space.
Recently, our multiagency team of scientists developed an operational data product that uses satellite data to calculate snowfall rates (SFR) over land, stated as a water equivalent intensity (in millimeters per hour) at a satellite footprint diameter of approximately 15 kilometers on the ground (Figure 1). Previously, satellite data were downloaded in batches after the completion of each full orbit, creating about 2 hours of lag time between observations and data delivery. This new product, however, exploits direct broadcast (DB) capability from several satellites in low Earth orbit that make microwave measurements over the continental United States and Alaska. These satellites send SFR measurements directly to ground-based receivers within 20 to 30 minutes of satellite observations.
 Fig. 1. Snowfall rate estimates for a 28 January 2014 storm that blanketed the southeastern United States. (a) Satellite snowfall rates captured by the SFR product at 11:19 a.m. and (b) the corresponding Next Generation Weather Radar (NEXRAD) composite radar reflectivity map. Credit: UCAR
These estimates aid National Oceanic and Atmospheric Administration (NOAA) National Weather Service (NWS) forecasters during snowfall events. Data-sparse forecast regions of the NWS like Alaska can benefit from using all available low Earth orbiting satellites and the DB capability to obtain regular, timely updates of the SFR.
The Need for Real-Time Snowfall InformationSnowstorms are among the most significant weather events, yet accurately measuring snow has been challenging.Snowstorms are among the most significant weather events, yet historically, accurately measuring snow has been challenging. Satellite snowfall retrievals can help fill in surface observational voids.
Falling snow can have significant economic impacts and can interrupt transportation on the ground and in the air. Major storms regularly cause disruptions over the course of several days in highly populated regions; however, even minor snowfall affects local commuting and highway travel, disrupting the commercial trucking industry.
The satellite maps that hinted at the impending “Snowpocalypse 2014” are examples of data products. These maps rely on mathematical models that process raw data on the amounts of microwave radiation that reach a variety of satellite sensors from cloud ice content and the land and ocean surfaces below. The maps display the relevant data (rainfall or snowfall rates, for example) in a form that weather forecasters can interpret and use.
Geostationary satellites are capable of frequent infrared measurements, but these measurements correlate poorly to snowfall rates on the ground. Conversely, low Earth orbiting passive microwave measurements can reliably detect snowfall within clouds, but these observations are less frequent, and there is a longer lag time between when the observations are made and when they are received at ground-based stations (data latency).
Product Motivation, Development, and EvolutionIn 1998, the first advanced microwave sounding unit (AMSU-B) was placed into operation on board the NOAA-15 satellite. After several years of demonstrating the utility of AMSU-B for monitoring global rainfall [Ferraro et al., 2005], many studies also showed the potential for monitoring falling snow as well [e.g., Kongoli et al., 2003; Skofronick-Jackson et al., 2004]. The AMSU-B sensor was followed by the Microwave Humidity Sounder (MHS) on NOAA and European Organisation for the Exploitation of Meteorological Satellites (EUMETSAT) satellites and, most recently, the Advanced Technology Microwave Sounder (ATMS) flown on the Suomi National Polar-orbiting Partnership satellite (Suomi NPP) and NOAA-20 satellites and the NASA Global Precipitation Measurement Microwave Imager (GMI).
All these sensors make measurements at critical frequencies at and above 85 gigahertz (GHz); sensors measure microwave emissions at 183 GHz, the signature frequency band emitted by water vapor, making it feasible to detect frozen hydrometeors (snow, ice, and the like) in the atmosphere. Earth’s surface is generally masked enough by atmospheric water vapor to isolate the 183-GHz signal associated with snow in the atmosphere from the signal at this frequency originating from snow on the ground [Kongoli et al., 2015; Meng et al., 2017].
The current operational SFR product was developed by scientists at NOAA and the National Environmental Satellite, Data, and Information Service (NESDIS), working in conjunction with training and product assessment specialists at NASA’s Short-term Prediction Research and Transition (SPoRT) Center.
Product AssessmentTo evaluate the usefulness of the SFR product for NWS forecast operations, NASA’s SPoRT Center led product assessments in collaboration with the NOAA algorithm developers at several NWS weather forecast offices from 2014 to 2016. Important feedback from the first winter season indicated that latency, the length of time between satellite observations and SFR availability, was a major factor limiting its application.
To solve the problem, the project team turned to DB data. With DB, a satellite can instantaneously transmit its observations to any ground station on Earth that has the appropriate antenna; most of the continental United States, Alaska, and Hawaii are equipped with such ground stations. Compared to the standard operational delivery options (batch downloads delivered to a few designated ground stations after the completion of each 100-minute orbit), DB of the data from the satellite to the user provides a substantial reduction in latency (about 1 hour).
The SFR project team retrieves the DB data, generates the SFR product, and sends the SFR data to SPoRT for reformatting within 30 minutes of satellite observations. SPoRT then delivers the resulting imagery to the weather forecast offices. The SFR developers at NOAA and NASA also maintain web pages where SFR images are posted in near-real time.
Testing the SFR Product in Albuquerque, N.M.The SFR product provides a unique, space-based perspective to easily identify the extent of a snowstorm, the location of the most intense snowfall, and the rain-snow boundary.The SFR product provides a unique, space-based perspective to easily identify the extent of a snowstorm, the location of the most intense snowfall, and the rain-snow boundary. These features are not generally apparent from traditional satellite imagery or surface radar.
On 14 January 2015, the Albuquerque, N.M., weather forecast office used the SFR product near the northwestern New Mexico town of Gallup, an area with very limited radar coverage. Feedback from this office indicated that the 2:19 a.m. Suomi NPP SFR image (Figure 2) matched ground-based observations better than the precipitation forecast from the North American Mesoscale Forecast System (NAM), a NOAA weather forecast model, within this data-sparse region.
 Fig. 2. (a) The Suomi NPP SFR data product captured a snowfall event in northwestern New Mexico on 14 January 2015 that was also observed at the local weather station at Gallup. (b) The white areas in the NEXRAD coverage map show that radar coverage is limited to nonexistent in this area (indicated by red arrow).
The NWS Albuquerque forecaster said, “From this information I was able to determine the NAM forecast was too slow with the evolution of the precipitation. The radar values dropped off away from the KABX [Albuquerque] radar, which is expected, whereas the SFR product increased in the area of heaviest snowfall. Rates were close to the observed value at KGUP (Gallup).”
Ground observations also included the web page for the New Mexico Department of Transportation, which indicated difficult driving conditions within this region. Although New Mexico is not a very densely populated state, the commercial trucking industry relies heavily on the interstate highway system. Thus, knowing the likelihood of snow-covered conditions or active falling snow (which reduces visibility) in remote areas is vital to the NWS for issuing travel advisories.
SFR Product Maps the March 2017 Nor’easterA major nor’easter (a storm that blows in from the northeast) swept over the U.S. East Coast on 14–15 March 2017. The SFR product retrieved data from five satellites to capture the evolution of the snowstorm. Comparison of the SFR data with Multi-Radar Multi-Sensor (MRMS) radar precipitation data produced by NOAA for the same location [Zhang et al., 2016] yielded strong correlations and low bias.
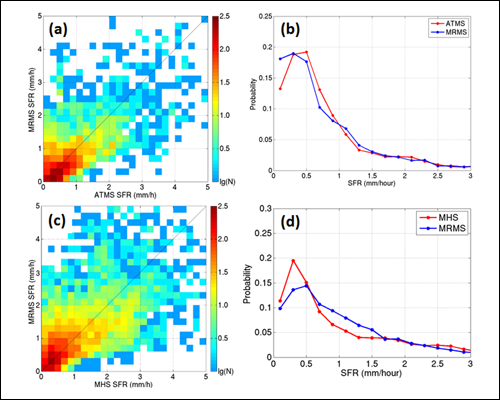 Fig. 3. SFR data product performance for the 14 March 2017 nor’easter on the U.S. East Coast. (a) Comparison of snowfall rates calculated using Advanced Technology Microwave Sounder (ATMS) data and the SFR product with those calculated using Multi-Radar Multi-Sensor (MRMS) radar precipitation data and (b) comparison between ATMS SFR and MRMS probability distribution functions. (c) A similar comparison between MHS SFR rates and MRMS radar precipitation data and (d) the corresponding probability distribution functions. The ATMS SFR performs slightly better than the MHS SFR: Note the smaller spread in the scatterplots (Figure 3a versus Figure 3c) and the better fit of the SFR distributions (Figure 3b versus Figure 3d).
These results create confidence in the reliability of the SFR in other regions where radar observations are limited. Figure 3 shows the scatterplots and probability distributions of ATMS and MHS SFR compared to MRMS. Because the ATMS sensor has a fuller set of channel compliments at the 183-GHz water vapor band, it performs slightly better than the SFR from MHS. Figure 4 provides a series of satellite SFR images, showing the progression of the snowfall rates during the storm.
Meeting the Snowfall Rate ChallengeOperational weather forecasters have provided valuable feedback on the product’s strengths and limitations, leading to substantial improvements to the algorithm.Snowfall is an important weather element, yet it is challenging to measure accurately and consistently, especially because ground measurements are limited in many regions. By exploiting DB data from low Earth orbiting satellites, an operational snowfall rate product can play an important role in providing timely observations for improved situational awareness, short-term forecasts, warnings, and verification in these regions. Operational weather forecasters have provided valuable feedback on the product’s strengths and limitations, and this feedback has led to substantial improvements to the algorithm over the past several years [Meng et al., 2017].
 Fig. 4. SFR time series showing the evolution of the 14 March 2017 nor’easter. The scale indicates the water equivalent of the SFR, ranging between 0 and 5 millimeters per hour. Satellite data were obtained from the areas shaded in pink; no data are available in the white areas.
In the near term, we plan to expand the SFR to include other sensors, further improving the temporal coverage of the product. Within the next 3 years, we will focus on extending the algorithm to offshore retrievals. Radars in these areas have limited range but are important to weather forecasts as active areas of snow approach, then move over land.
AcknowledgmentsThe authors acknowledge NOAA’s Joint Polar Satellite System Proving Ground and Risk Reduction Program, the NASA Earth Science Division, and the NESDIS Center for Satellite Applications and Research for supporting this project. We also acknowledge our NASA partners at the Global Precipitation Measurement and SPoRT programs, with whom we have worked jointly on various aspects of snowfall rate retrievals for many years. The views, opinions, and findings contained in this report are those of the authors and should not be construed as an official National Oceanic and Atmospheric Administration or U.S. government position, policy, or decision.
The post Snowfall Rates from Satellite Data Help Weather Forecasters appeared first on Eos.
from Eos https://eos.org/project-updates/snowfall-rates-from-satellite-data-help-weather-forecasters?utm_source=rss&utm_medium=rss&utm_content=snowfall-rates-from-satellite-data-help-weather-forecasters
via IFTTT
